How to Read DMARC XML Reports
DMARC aggregate reports are XML files that look intimidating but follow a predictable structure. Learn to read them manually.
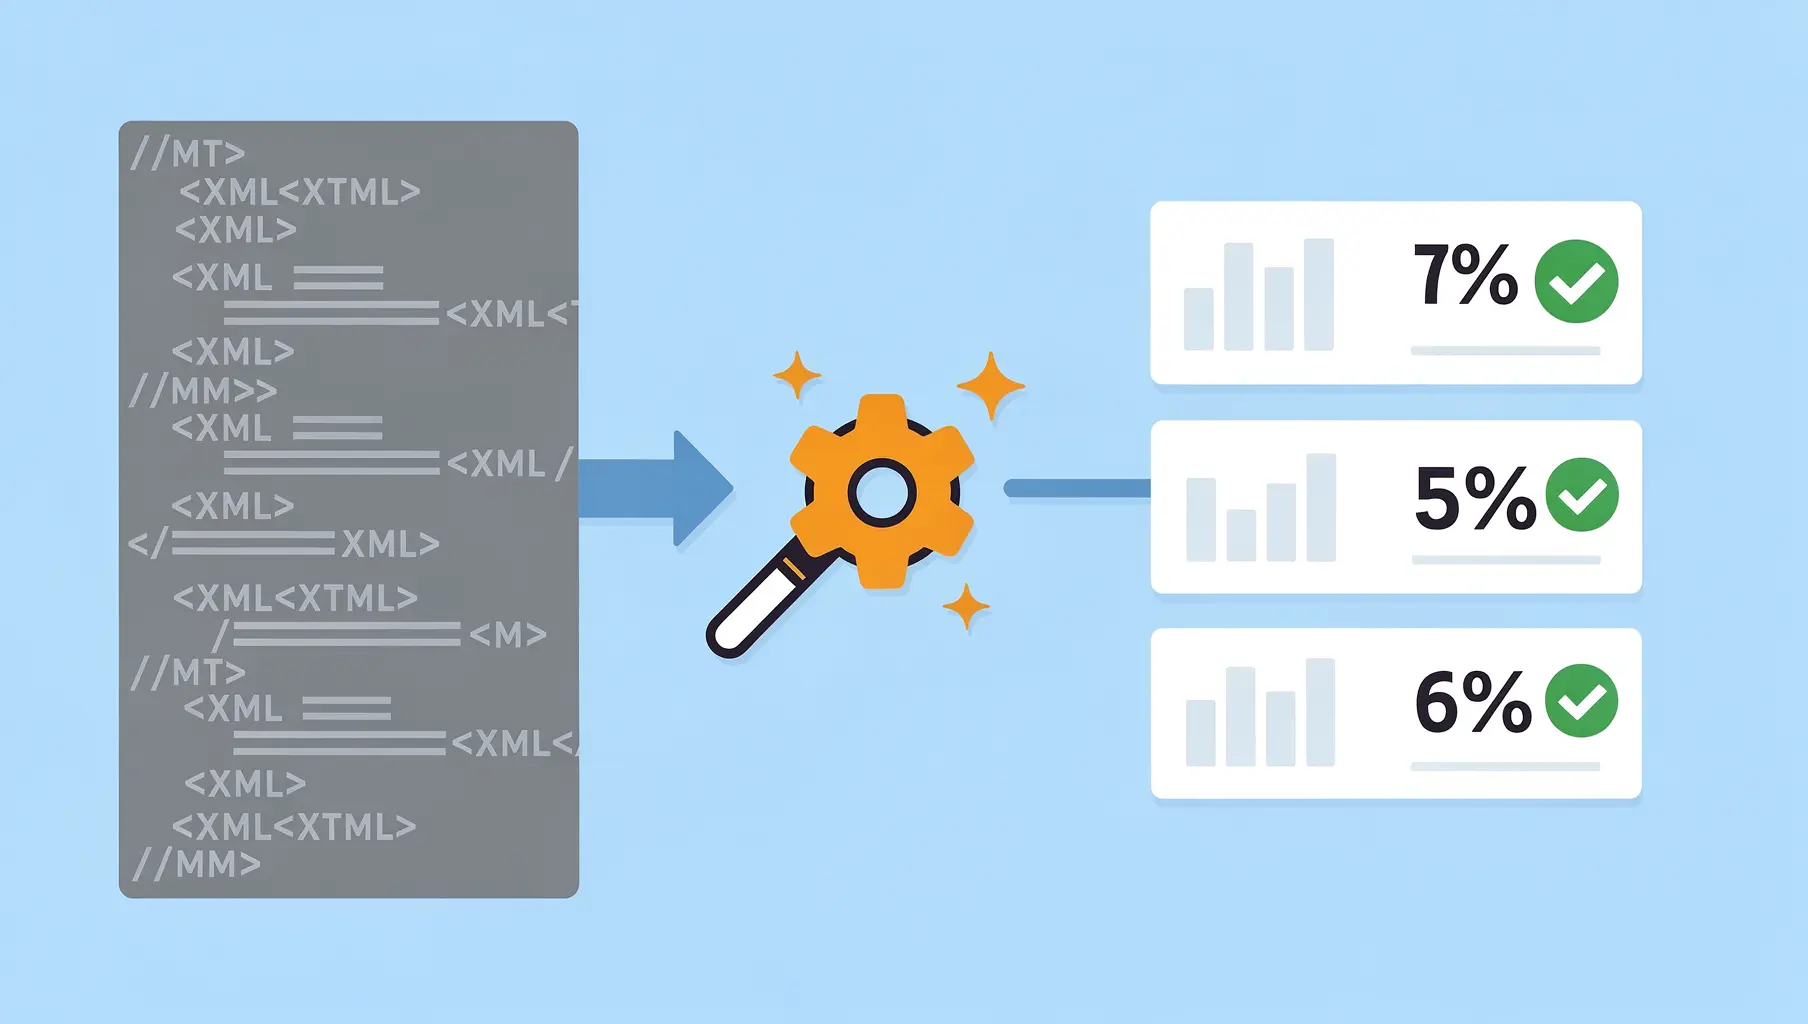
DMARC aggregate reports follow a predictable structure: metadata about the reporter, your published policy, and rows showing authentication results per source IP. Once you understand the layout, they’re not as intimidating as they first appear.
You’ll probably use a monitoring service for ongoing analysis, but knowing how to read raw reports helps when troubleshooting or verifying what tools tell you.
What You Receive
DMARC aggregate reports arrive as:
- Email attachments
- Compressed files (.zip or .gz)
- XML content inside
The filename usually indicates the sender and date range:
google.com!yourdomain.com!1703980800!1704067199.xmlThe Report Structure
Every DMARC report has three main sections:
<?xml version="1.0" encoding="UTF-8"?>
<feedback>
  <report_metadata>...</report_metadata>
  <policy_published>...</policy_published>
  <record>...</record>
  <record>...</record>
  <!-- More records -->
</feedback>
Let’s break down each section.
Section 1: Report Metadata
<report_metadata>
  <org_name>google.com</org_name>
  <email>[email protected]</email>
  <report_id>12345678901234567890</report_id>
  <date_range>
    <begin>1703980800</begin>
    <end>1704067199</end>
  </date_range>
</report_metadata>| Field | What It Tells You |
|---|---|
org_name | Who generated the report (Google, Microsoft, etc.) |
email | Contact for the reporting organization |
report_id | Unique identifier for this report |
date_range | Unix timestamps for the period covered |
Converting timestamps: Use an online converter or:
date -d @1703980800
# Outputs: Sat Dec 30 2023 ...
This tells you what 24-hour period the report covers.
Section 2: Policy Published
<policy_published>
  <domain>yourdomain.com</domain>
  <adkim>r</adkim>
  <aspf>r</aspf>
  <p>reject</p>
  <sp>reject</sp>
  <pct>100</pct>
</policy_published>
This shows your DMARC policy as the reporter saw it:
| Field | Meaning |
|---|---|
domain | Your domain |
adkim | DKIM alignment mode (r=relaxed, s=strict) |
aspf | SPF alignment mode (r=relaxed, s=strict) |
p | Your policy (none, quarantine, reject) |
sp | Subdomain policy |
pct | Percentage of messages policy applies to |
If this doesn’t match what you think your policy is, check your DNS record.
Section 3: Records (The Important Part)
Each <record> represents one source IP and its authentication results:
<record>
  <row>
    <source_ip>209.85.220.41</source_ip>
    <count>1523</count>
    <policy_evaluated>
      <disposition>none</disposition>
      <dkim>pass</dkim>
      <spf>pass</spf>
    </policy_evaluated>
  </row>
  <identifiers>
    <header_from>yourdomain.com</header_from>
  </identifiers>
  <auth_results>
    <dkim>
      <domain>yourdomain.com</domain>
      <result>pass</result>
      <selector>google</selector>
    </dkim>
    <spf>
      <domain>yourdomain.com</domain>
      <result>pass</result>
    </spf>
  </auth_results>
</record>
Breaking Down a Record
The <row> section:
source_ip: The IP address that sent emailcount: How many messages from this IPdisposition: What happened (none, quarantine, reject)dkim/spf: Pass or fail for DMARC evaluation
The <identifiers> section:
header_from: The From address domain in the email
The <auth_results> section:
- Raw SPF and DKIM check results
- Which domain was checked
- For DKIM: which selector was used
Reading for Failures
When troubleshooting, look for records where:
<policy_evaluated>
  <dkim>fail</dkim>
  <spf>fail</spf>
</policy_evaluated>
Both failing means DMARC failed. Look at:
- source_ip: Who sent this? Look up the IP.
- count: How many messages? High count means a bigger problem.
- auth_results: Why did it fail?
Common Failure Patterns
SPF fail, DKIM pass:
<dkim>pass</dkim>
<spf>fail</spf>
The sender isn’t in your SPF record, but DKIM saved it. DMARC passes (only one needs to pass with alignment).
SPF pass, DKIM fail:
<dkim>fail</dkim>
<spf>pass</spf>
DKIM isn’t configured for this sender, but SPF worked. Still passes DMARC.
Both fail:
<dkim>fail</dkim>
<spf>fail</spf>
Neither authentication method worked. This is either:
- Legitimate sender not configured properly
- Unauthorized sender (spoofing attempt)
- Forwarded email (breaks SPF, might break DKIM)
Looking Up Source IPs
When you see an unfamiliar IP, identify it:
# Reverse DNS
dig -x 209.85.220.41

# Or use whois
whois 209.85.220.41
Common results:
google.com: Google Workspace or Gmailsendgrid.net: SendGridamazonses.com: Amazon SESoutlook.com: Microsoft
If you can’t identify the IP and both auth methods fail, it might be spoofing.
A Real-World Example
Here’s a complete record with explanation:
<record>
  <row>
    <source_ip>198.2.135.42</source_ip>
    <count>847</count>
    <policy_evaluated>
      <disposition>none</disposition>
      <dkim>fail</dkim>
      <spf>fail</spf>
    </policy_evaluated>
  </row>
  <identifiers>
    <header_from>yourdomain.com</header_from>
  </identifiers>
  <auth_results>
    <spf>
      <domain>bounces.sendgrid.net</domain>
      <result>pass</result>
    </spf>
  </auth_results>
</record>
What this tells us:
- 847 emails from 198.2.135.42
- DMARC failed (both dkim and spf failed in policy_evaluated)
- SPF did pass, but for
bounces.sendgrid.net, notyourdomain.com - This is an alignment failure. SendGrid’s SPF passed for
bounces.sendgrid.net, but that domain doesn’t align with yourheader_fromofyourdomain.com
The fix: Configure DKIM for SendGrid, or use a custom return-path domain.
Processing Multiple Reports
You’ll receive reports from many providers. Each covers their perspective:
- Google reports what Gmail/Workspace saw
- Microsoft reports what Outlook saw
- Yahoo, Comcast, etc.
To get a complete picture, you need to aggregate across all reports. This is where monitoring services help: they combine every provider into one view.
Tools for Parsing
If you want to process reports yourself:
Command line:
# Decompress
gunzip report.xml.gz

# Pretty print
xmllint --format report.xml

# Extract source IPs with failures
grep -B5 "<spf>fail" report.xml
Python libraries:
xml.etree.ElementTree(built-in)- Various DMARC-specific parsers on PyPI
Online parsers:
- Use our free DMARC Report Parser. Paste the XML or upload the file, get a readable view of sources, pass rates, and failures.
- Useful when you have a single report in hand and want a quick read without writing a script.
When to Read Reports Manually
Most of the time, use a monitoring service. Manual reading is useful when:
- Troubleshooting a specific failure
- Verifying what a tool is telling you
- Learning how DMARC works
- Investigating a security incident
- Your monitoring service is down
Quick Reference
| Element | Location | What It Means |
|---|---|---|
source_ip | row | Who sent the email |
count | row | How many messages |
disposition | policy_evaluated | What receiver did |
dkim/spf | policy_evaluated | Pass/fail for DMARC |
domain | auth_results | What domain was checked |
result | auth_results | Raw auth result |
For more on interpreting what you find, see Understanding DMARC Reports.
If you have a single report in front of you right now and don’t want to read XML, paste it into our free DMARC Report Parser for a readable view.
Verkh ingests your DMARC reports daily, groups sources, and flags week-over-week changes so you don’t have to read XML to know what’s happening. Start Free. No credit card.
Related Articles
November 2025
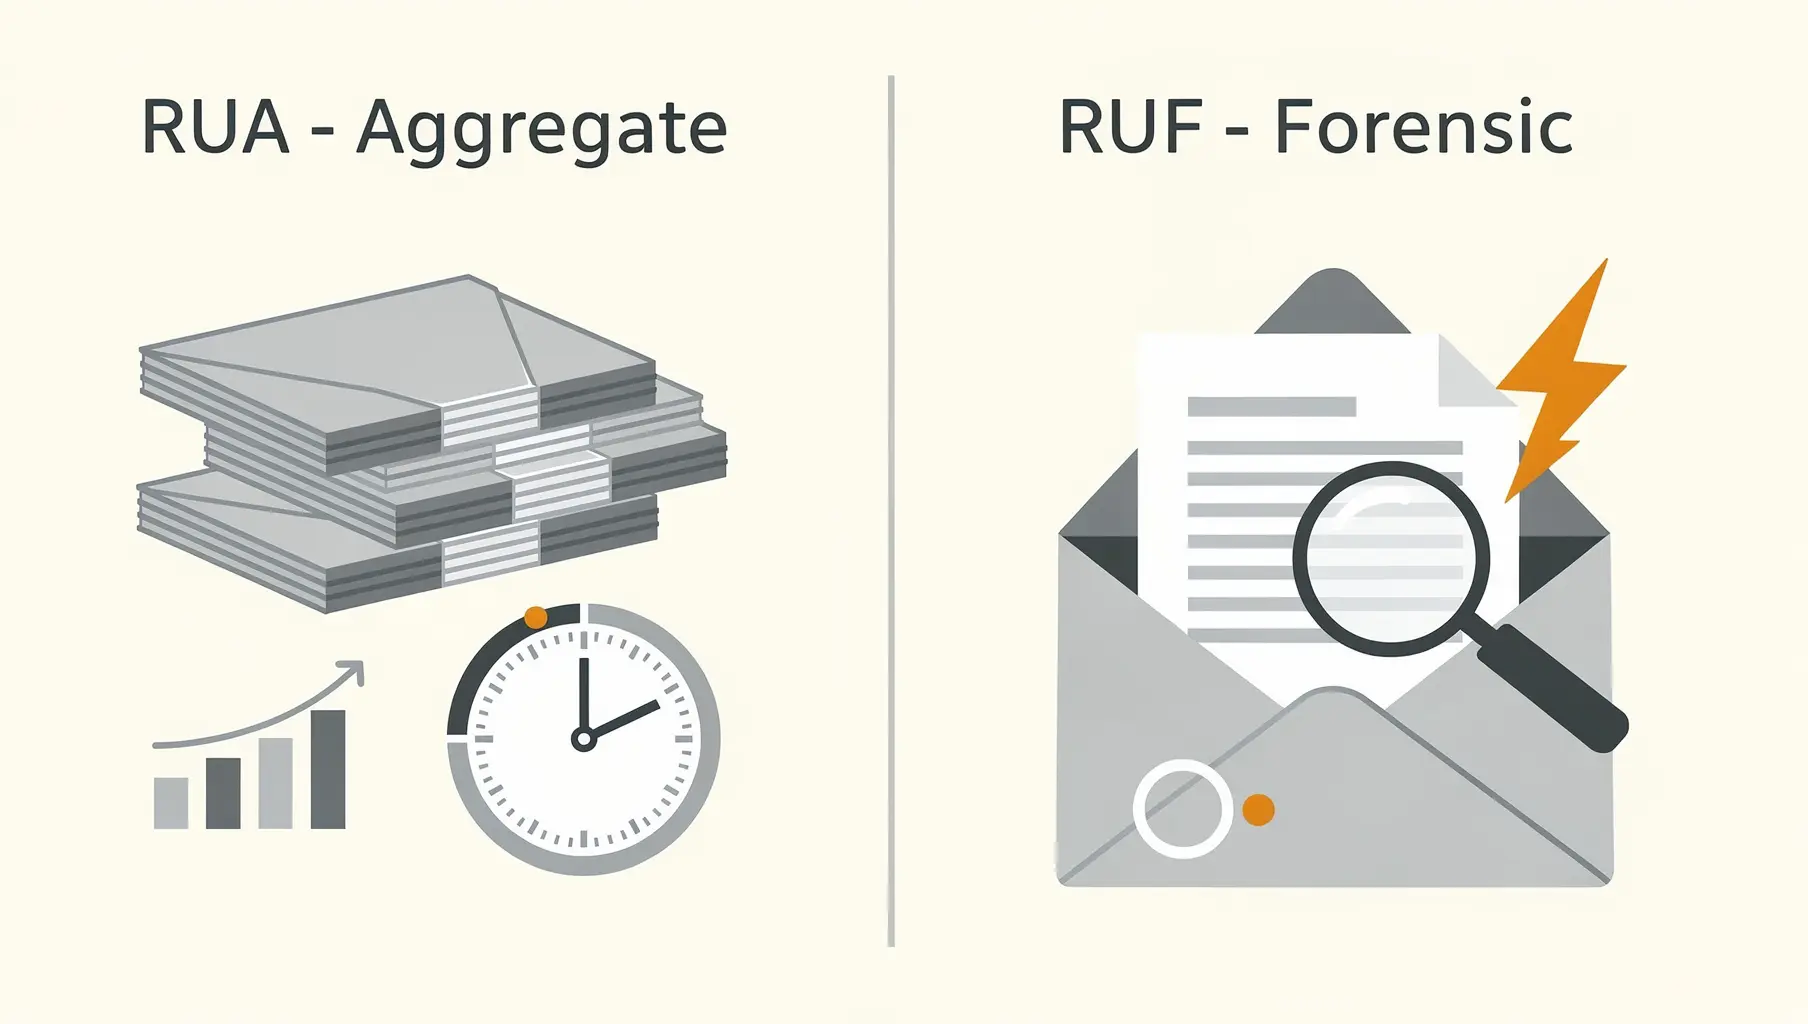
RUA vs RUF: Understanding DMARC Report Types
DMARC has two report types: RUA (aggregate) and RUF (forensic). Learn what each contains, which you need, and why most organizations only use RUA.
December 2025
Why Am I Not Receiving DMARC Reports?
Set up DMARC but no reports are arriving? Here are the most common reasons and how to fix them, from DNS propagation delays to RUA configuration issues.

May 2026
RFC 9989: The New DMARC Standard, Explained
DMARC is now an Internet Standard. RFC 9989 obsoletes RFC 7489: a DNS Tree Walk replaces the PSL, the pct tag is removed, and more. Here's what changed.
Ready to implement this?
Verkh helps you monitor DMARC, identify issues, and reach enforcement. Start free.
Start Free